Eleven-year-olds tell a different story
21st December 2015 by Timo Hannay [link]
A few days ago the Department for Education released the results of the Key Stage 2 tests taken earlier this year by 11-year-olds at state primary schools across England. The same data are now available on our Maps, so it's perhaps interesting to take a look at what they show.
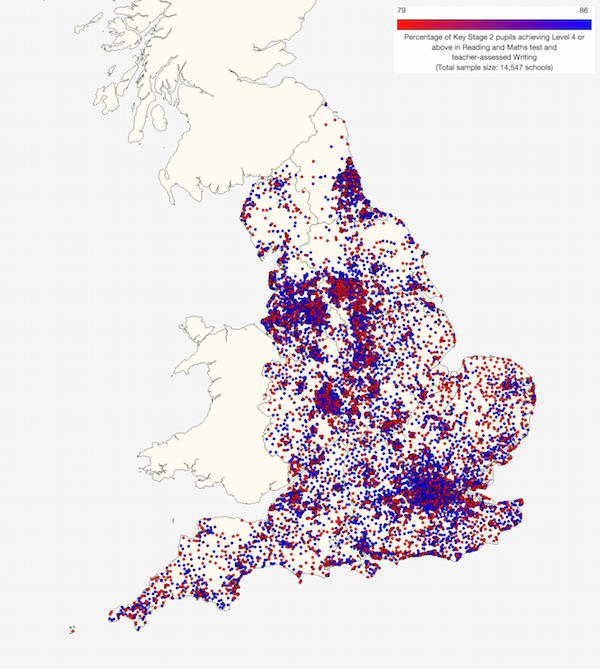
As ever, it's a complex picture, with over- and underperforming schools in every part of the country:
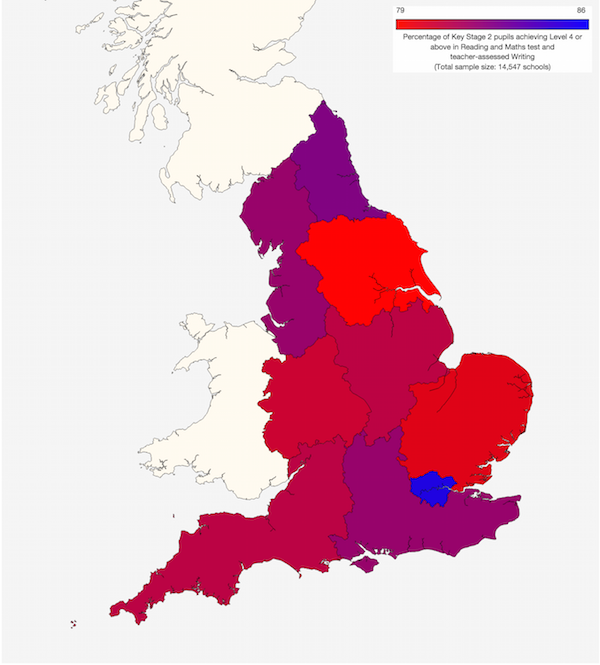
However, there are also some interesting regional trends and, notwithstanding reports to the contrary, they tell a very different story to the GCSE results we covered here last month:
Overall, London does exceptionally well (again), but the North East comes second, followed by the South East and the North West. So in contrast to GCSE results, there's no clear north-south gradient in primary attainment.
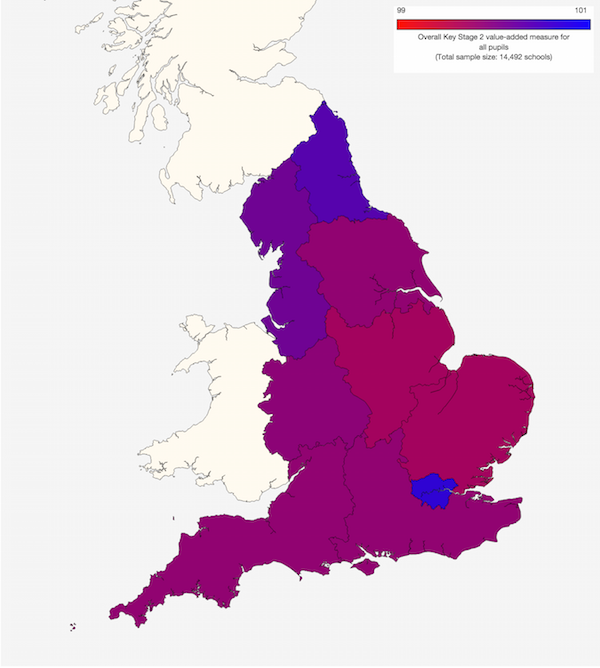
The DfE's Value-Added measure shows that these higher-performing regions are not simply starting with the most able pupils:
On the contrary, the North East has the highest level of academic underperformance at age 7, and London and the North East contain the highest proportions of pupils from deprived families. You can also see this impressive performance in the subject-specific progress that pupils make in reading, writing and maths.
This difference in Value Add comes largely as a result of these regions doing an exceptional job in raising the attainment of pupils who previously struggled during Key Stage 1 (up to 7 years old). As a result, they are also the most successful at reducing the difference between pupils who previously showed low attainment and those who who showed high attainment at age 7.
Where London and the South East do tend to perform well is among that small subsets of pupils who greatly exceed national expectations by reaching Level 6 (the national target is Level 4). This is evident in reading, GPS (grammar, punctuation and spelling), maths and science.
In general, the lowest-performing region at age 11 is Yorkshire and The Humber. This is in part because children there are, on average, already behind in some subjects, such as reading, at age 7. However, children in the North East and North West are almost as far behind at that stage and yet manage to catch up (and then some) by age 11.
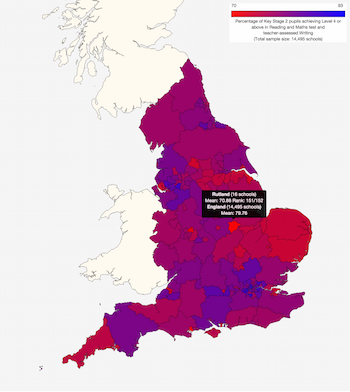
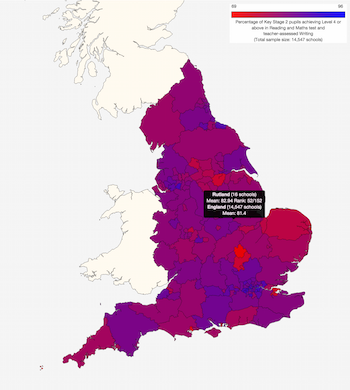
At the authority level, Bedford, Poole, Medway and Doncaster all stand out as underperformers. But we should close with a word of congratulation to Rutland, which was almost bottom of the country in 2014 (below left) – only Poole did worse – but in 2015 (below right) pulled itself up to above the national average. Whatever happened there, it might be worth studying.
A nation divided?
1st December 2015 by Timo Hannay [link]
Today saw the publication of Ofsted's annual review on education standards. As the BBC and the Guardian (and others) have reported, this expresses concern about the north-south divide among schools in England, something that I've written about before on this very blog.
Consistent with SchoolDash's previous analysis, Ofsted concludes that this disparity is particularly acute in secondary schools, and that while levels of poverty and other sociodemographic factors surely play an important part, they do not fully explain it, nor can they be used as an excuse for tolerating the status quo.
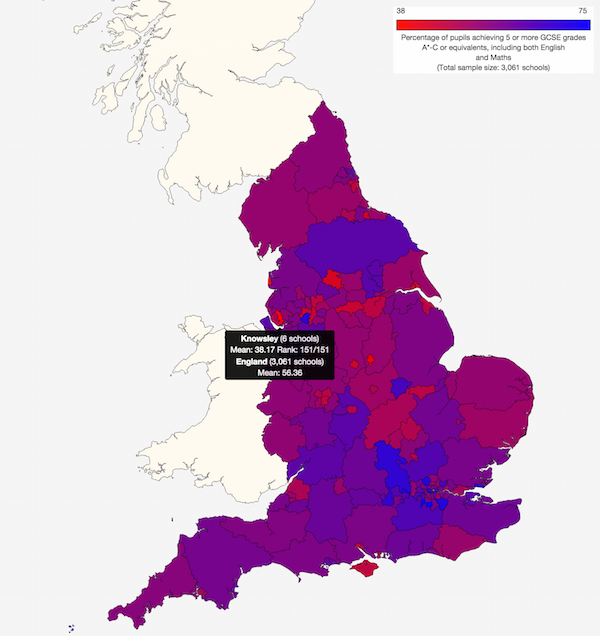
The BBC report provides a list from Watchsted of local authorities that have very low proportions of "good" or "outstanding" Ofsted-rated schools. The secondary school list corresponds reasonably well (though by no means perfectly) with those authority areas with poor average academic attainment at age 16, as measured by the average proportions of pupils getting five good GCSEs:
For example, Knowsley in Merseyside and Blackpool come out poorly in both analyses. True, there are underperforming areas in the south too, most notably the Isle of Wight, but on the whole these tend to be less numerous and less bad than in the north.
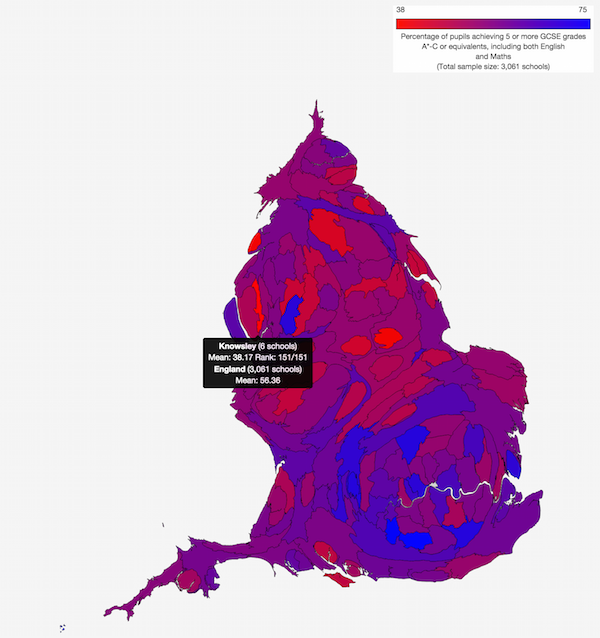
Normal geographical maps underplay the significance of the relatively small but densely populated areas that are home to most schools and families, so it's perhaps more instructive to look at the equivalent 'cartogram' in which each local authority area has been scaled according to the number of pupils going to school there. I think this makes the differences between the north and south even easier to see, as well as highlighting some underperforming areas (such as Southampton) that are otherwise difficult to see:
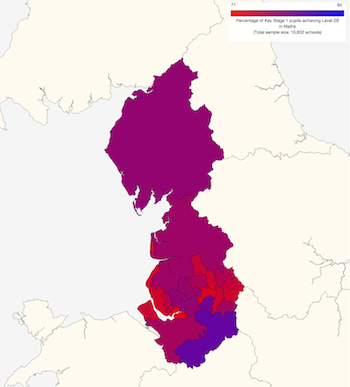
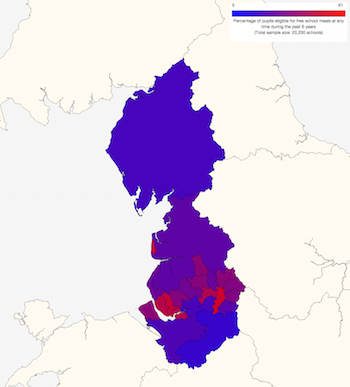
Given that some of the most striking examples of GCSE underperformance are in the North West, it is perhaps worth looking at that region in more detail. What we see here is quite widespread underperformance at age 7 for maths (below left), and similar patterns for reading and writing. This corresponds reasonably well with deprivation, as measured by eligibility for free school meals (below right). Note that the latter map uses an inverted colour scale to make it easier to see the correspondence between low academic attain and high deprivation:
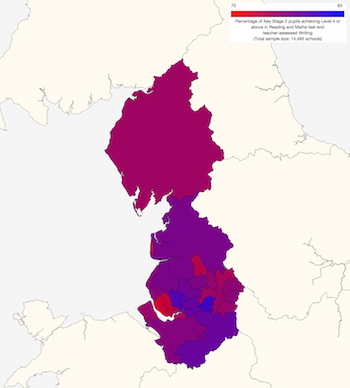
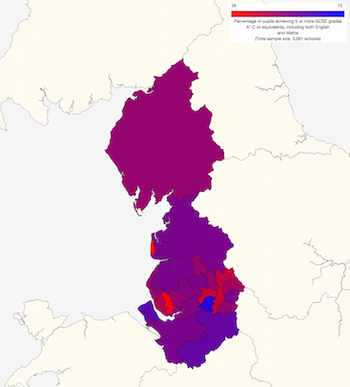
By age 11 (Key Stage 2) many areas have pulled themselves up to around to the national average (blue and mauve areas, below left). However, by GCSEs at age 16 (below right), some areas have fallen back again, and Knowsley and Blackpool are further behind than ever:
This helps to explain why Ofsted is focusing its attention on the relative underperformance of secondary schools – on the whole, primary schools in the north of England seem to do rather well.
What's to be done? That's a tough question, especially for someone like me who is neither a policymaker nor an educationalist. Last week I attended a conference on the north-south divide hosted by Jesus College, Cambridge. What struck me as I listened to the other participants was the deep historical legacy behind this trend, and also the breadth of its impact across all areas of our society and economy. But I was also reassured by the huge amount of intellectual and political will – not to mention general goodwill – that was evident. If there was a divide in that conference room then it was not between those who thought there was a problem and those who didn't. Rather, it was between the pessimists, who felt that the differences are too entrenched to overcome, and the optimists, who pointed to the many existing strengths and successes of the north of England.
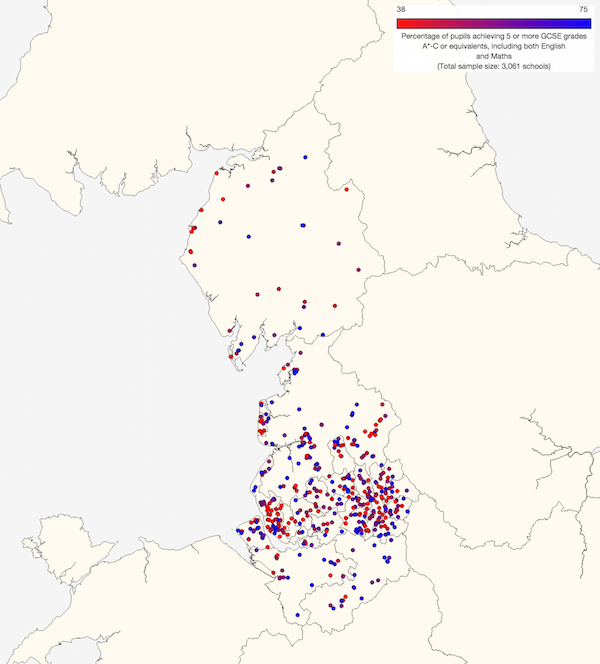
In this light it is perhaps worth reminding ourselves that it is decidedly not all grim up north (or all sweetness and light down south). Just look at this map of individual school GCSE performance in the North West:
As elsewhere in the country, we see high-performing schools (blue) nestled alongside struggling ones (red). No doubt there is something of a Matthew effect ("unto every one that hath shall be given"), with already successful schools able to attract the most able pupils, attentive parents and effective community engagement. Any school coming from behind is not only racing to catch up but also combating their own particular headwinds. Yet with the right kind of support it can surely be done. One suggestion, also reported today, is the idea of pairing struggling schools with more successful ones, an approach apparently used to good effect in the London Challenge initiative. Especially given the geographical proximity of many such differently performing schools, that sounds to me like something worth trying.
In a couple of weeks' time I, an almost lifelong southerner, will be venturing north to visit a school that has been underperforming but now has an extremely talented and committed headteacher who's working hard to turn it around. For me that will no doubt provide a glimpse into the harsh realities behind the rather abstract numbers with which I spend so much time – a dot on the map made real. I look forward to it greatly.
About
This is the SchoolDash blog, where we write about education, data geekery and other things that spark our interest.
Blue links take you to other parts of the page, or to other web pages. Red links control the figures to show you what we're talking about.
Archives
- December 2025
- November 2025
- October 2025
- September 2025
- August 2025
- July 2025
- June 2025
- April 2025
- November 2024
- October 2024
- June 2024
- April 2024
- March 2024
- February 2024
- November 2023
- October 2023
- June 2023
- May 2023
- April 2023
- March 2023
- February 2023
- January 2023
- December 2022
- November 2022
- October 2022
- September 2022
- August 2022
- June 2022
- April 2022
- February 2022
- January 2022
- December 2021
- November 2021
- October 2021
- August 2021
- July 2021
- May 2021
- February 2021
- January 2021
- November 2020
- October 2020
- August 2020
- July 2020
- June 2020
- May 2020
- April 2020
- March 2020
- January 2020
- December 2019
- November 2019
- August 2019
- July 2019
- April 2019
- March 2019
- January 2019
- November 2018
- October 2018
- August 2018
- July 2018
- April 2018
- January 2018
- November 2017
- October 2017
- July 2017
- June 2017
- May 2017
- March 2017
- December 2016
- October 2016
- September 2016
- August 2016
- July 2016
- June 2016
- May 2016
- April 2016
- March 2016
- January 2016
- December 2015
- November 2015
- October 2015
- September 2015
| Copyright © 2026 |
