Faith in schools
29th November 2018 by Timo Hannay [link]
One of the most distinctive characteristics of the British education system is that, although we are in most ways a secular liberal democracy1, religious institutions make up a large proportion of our schools, even in the state sector. This post looks at the numbers and distributions of such schools in England, as well as their academic performance and effects on segregation. Our findings include the following:
- Faith schools in England show distinctive geographical distributions. For example, Church of England (C of E) schools are often located in rural areas around large conurbations, while Catholic schools are most prevalent in the North West. These patterns are especially clear for primary schools.
- Since at least 2011, primary pupil numbers at C of E and Catholic schools have been growing at slower rates than the overall increase in primary school enrolment. Those at non-faith schools and non-Christian faith schools have increased at higher rates. Pupils at non-Christian faith state schools nearly doubled between 2011 and 2018, though they still account for only 0.5% of all state primary school pupils.
- Among secondary pupils, too, enrolment at Catholic schools showed a relative decline. Pupil numbers at non-faith schools have been broadly flat while those at C of E schools have increased slightly. Once again, enrolment at non-Christian faith schools showed rapid growth, especially in the state sector, where pupil numbers doubled between 2011 and 2018, though they still represent only 0.6% of all state secondary school pupils.
- Faith schools tend to show better academic results at both primary and secondary phases, but these effects vary by faith type and seem to be mainly a result of differences in intake rather than anything that goes on inside the schools themselves.
- Many types of faith school show higher levels of segregation than non-faith schools, not only with respect to ethnicity but also deprivation.
Some of these findings are reported in the current issue of The Economist. For more detail, read on.
The laity of the land
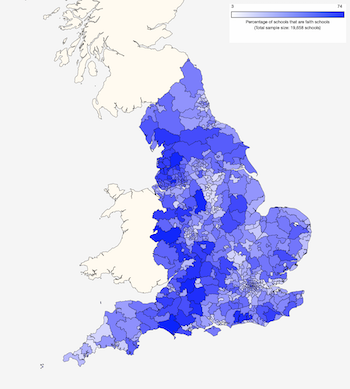
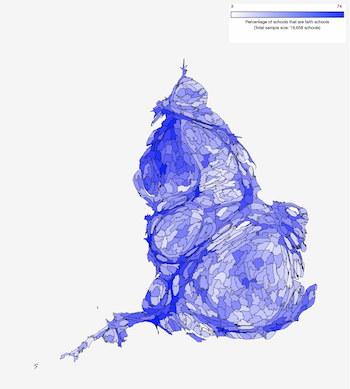
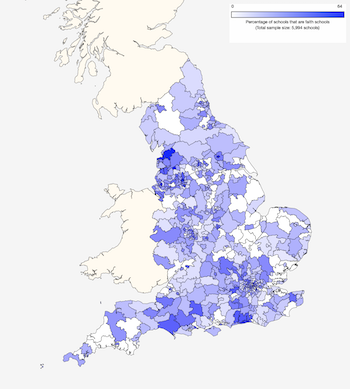
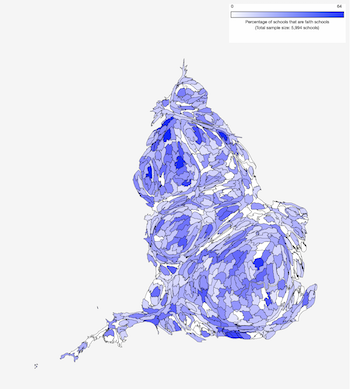
Map 1 (below left) shows the proportions of primary schools in England that are faith schools of any kind (each coloured area is a parliamentary constituency). The highest concentrations of faith schools tend to lie in a line than runs down the western side of the country, from Cumbria in the north to Dorset in the south. However, this view obscures the urban areas where most schools are located. To correct this, Map 2 (below right) scales each constituency based on the number of pupils who go to school there. This more clearly reveals that faith-based primary schools tend to be located in the areas outside major urban centres such as London and Birmingham, as well as in the North West. (Click on these maps or any of the others that follow to be taken to larger interactive versions.)
Maps 1 and 2: Proportions of primary schools that are faith schools (2018)
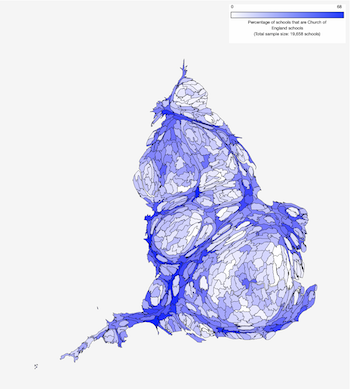
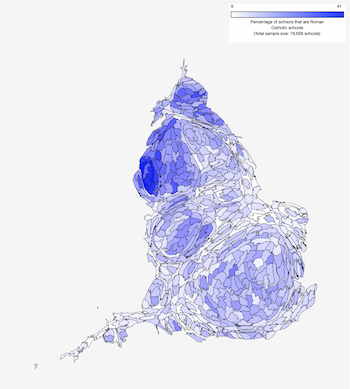
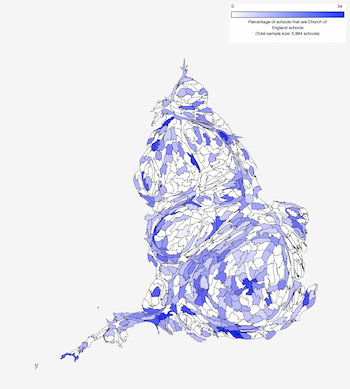
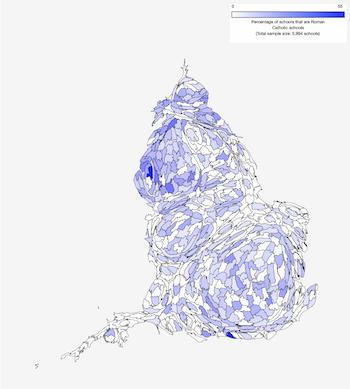
Map 3 (below left) shows proportions of Church of England (C of E) primary schools, the most common type of faith school in England. These are mostly responsible for the relatively high concentrations of faith-based primary schools seen outside large conurbations. Map 4 (below right) shows the same data for Catholic primary schools, which are disproportionately located in the North West and the North East.
Maps 3 and 4: Proportions of primary schools that are Church of England / Roman Catholic schools (2018)
Other types of Christian faith school and non-Christian faith schools2 are far less numerous and their distributions spottier. (Those maps are not shown here, but to see them follow the links in the preceding sentence.) Unsurprisingly, the latter group tend to be located in cities such as London, Birmingham, Leicester and Manchester that have large ethnic populations.
Maps 5 and 6 below show the proportions of secondary schools in England that are faith schools. The overall percentages are lower than for primary schools and their distribution is different, with more hotspots in urban areas.
Maps 5 and 6: Proportions of secondary schools that are faith schools (2018)
Maps 7 and 8 show the proportions of, respectively, C of E and Catholic secondary schools. The distribution of C of E secondary schools has echoes of that for C of E primary schools, with many located outside major urban centres, though there are exceptions, most notably in central London. Catholic secondary schools also show some similarities to the corresponding group of primary schools, with somewhat higher concentrations in the North West, though the effect is less dramatic than that seen in Map 4.
Maps 7 and 8: Proportions of secondary schools that are Church of England / Roman Catholic schools (2018)
As with primary schools, the maps for other Christian and non-Christian secondary schools are not shown here, but can be viewed by following the links provided.
Losing our religion?
So much for their locations, what about faith school numbers and the ways in which these may (or may not) have changed over time? Figure 1 shows the numbers of primary schools in England by faith category for the period 2011-2018. The total number of primary schools – currently just over 18,500 – has grown barely at all and the proportion of independent schools has stayed constant at 7.9%. However, this very stable overall picture hides a variety of trends for different groups of faith schools.
First, it's worth pointing out that nearly 12,000 primary schools – almost two-thirds of the total – are not affiliated with any religion. The proportion among state schools has stayed constant at 63%. The proportion among independent schools has grown (from 52% in 2011 to 68% in 2018), but this is mainly because the DfE recategorised a large number of independent schools in 2015. (This is a 'feature' of the data that will crop up repeatedly in the analysis that follows; it is described in more detail in Footnote 3.)
Church of England (C of E) state primary schools have grown slightly since 2011 (from 4,415 to 4,439) but only in line with the overall increase in primary schools, so their proportion has stayed more or less constant at 26%. The number and proportion of independent C of E primary schools have fallen, from 221 (15% of all independent primary schools) in 2011 to 122 (8.4%) in 2018, but once again this was mainly due to a large number of recategorisations in 2015; since then their number and proportion have declined only slightly. Catholic state primary schools have reduced a bit in number, from 1,670 (9.9% of the total) in 2011 to 1,658 (9.7%) in 2018. Independent Catholic primary schools have declined too, from 94 (6.5%) in 2011 to 73 (5.0%) in 2018, but this was also due in large part to the 2015 recategorisations.
Unlike C of E and Catholic schools, the majority of primary schools with other Christian denominations (including joint or non-specific Christian affiliations) are independent. But even taking independent and state schools together, these account for only 262 schools in 2018, a mere 1.4% of the total. Once again we see a large dip in independent school numbers in 2015 due to DfE recategorisations.
Perhaps most interesting are the other faith primary schools, which account for a very small proportion of all schools (only 1.0% in 2018), but have been growing rapidly in recent years. Nearly two-thirds of them are independent schools, but that group has actually declined in recent years while the number of state schools has continued to grow rapidly – up from 40 in 2011 to 66 in 2018, a rise of 65%.
(Use the menu in Figure 1 to view different faith school types. Click on the legend to turn groups of schools on or off. Hover over the graph to see details of each data point.)
Figure 1: Number of primary schools by faith type
Of course, schools change in size as well as number. Figure 2 shows similar data but this time for numbers of pupils rather than schools. The total number of primary school pupils has grown by 16% since 2011, through state pupil numbers have grown much more quickly (+18%) than independent pupil numbers (+4.0%). Pupils at schools with no religious affiliation have grown even more quickly than this overall rate (+20% among state schools), while C of E schools and (+14%) and Catholic schools (+7.1%) have both failed to keep pace. The only faith schools group to show above-trend gains in pupil numbers are non-Christian faith schools, which grew by 48% between 2011 and 2018. The subgroup of non-Christian state schools grew by a whopping 85% and now accounts for almost as many pupils as non-Christian independent schools. Even so, non-Christian faith schools still only account for 0.9% of all primary pupils and just 0.5% of state primary pupils.
Figure 2: Number of primary school pupils by school faith type
What of secondary schools? As shown in Figure 3, overall school numbers grew from 4,417 in 2011 to 4,647 in 2018 (+5.2%). Independent schools are of course in the minority but have increased in number more rapidly (+10% since 2011) than state schools (+3.5%) and now account for 27% of all secondary schools, up from 26% in 2011. Like primary schools, most secondary schools are not affiliated with any religion, though the proportions here are even higher (76% in 2018 compared with 64% of primary schools). In contrast to primary schools, Catholic state secondary schools are more numerous than their C of E equivalents. However, both showed declines in relative numbers, with Catholic schools falling from 10.0% of all state secondary schools in 2011 to 9.3% in 2018, and C of E schools declining from 6.5% to 6.2% over the same period. In contrast, non-Christian faith schools increased over the same period from 129 schools (2.9% of the total) to 161 (3.4%).
Figure 3: Number of secondary schools by faith type
Figure 4 shows the equivalent analysis for secondary pupils. Total pupil numbers have barely budged, rising just 0.6% between 2011 and 2018. In fact, all of this seems to be accounted for by a modest rise in independent school enrolment (+4.2%), while state secondary school pupil numbers hardly went up at all. Enrolment at schools with no religious affiliation has stayed broadly flat and accounts for 82% of all state secondary pupils, the same as in 2011. C of E state secondary schools showed modest pupil increases (despite the reduction in number of schools seen above) and now account for 6.1% of all state secondary pupils, up from 5.7% in 2011. In contrast, Catholic schools showed slight declines in pupil numbers and now account for 9.5% of all state secondary pupils, down from 9.7% in 2011. Once again, non-Christian faith schools showed the strongest gains, albeit from a low base. Total pupil numbers across state and independent sectors rose by 45% between 2011 and 2018, but almost all of this growth was in the state sector, which doubled its pupil headcount. Nevertheless, pupils in non-Christian faith schools still account for only 1.2% of all secondary pupils and just 0.6% of state secondary pupils.
Figure 4: Number of secondary school pupils by school faith type
The Pilgrim's progress
These gradual but significant changes in school and pupil composition have presumably been driven by demographic and cultural changes – the whole country is becoming less Christian and more secular. Indeed, given these broader societal shifts, it's perhaps surprising that the education system hasn't changed more. One reason might be inertia. Another could be parental preference: it's clear that many families are attracted to faith schools not for their religious ethos but because they are thought to offer better academic results. Does this reputation have any basis in fact?
Only partially. Figure 5 compares the proportions of pupils achieving the expect standard in reading, writing and maths at age 11. When we compare C of E primary schools (red) with all non-faith primary schools (dark blue), the former come out ahead by about 3 percentage points – a modest but material difference. However, this comparison fails to allow for the fact that, on average, faith schools tend to attract different kinds of pupils to non-faith schools. To control for this, the middle column (light blue) shows results for a subset of non-faith schools that have been selected to match as closely as possible the pupil characteristics of C of E schools (in terms of the proportions of pupils eligible for free school meals, those with special education needs and those having English as an additional language). This allows us to separate the effects of a school's intake from those of its actual teaching. On this measure, C of E schools do slightly worse than similar non-faith schools, though the difference is so small that we can reasonably declare it a score draw.
A similar comparison for Catholic primary schools shows a larger gap of almost 6 percentage points, just over half of which is eliminated after controlling for intake. Non-Christian faith schools show a bigger gap of nearly 10 percentage points, but again most of this seems to be attributable to intake. Other Christian schools show an underperformance of more than 2 percentage points after controlling for intake.
On the whole, then, faith-based primary schools do tend to show better results than non-faith schools, but this varies by faith type and where there is a positive effect it seems to be mainly a result of the pupils they attract rather than anything that goes on inside the school itself.
Figure 5: Primary school performance by faith school type (2017)
Figure 6 shows a similar analysis of secondary school performance, this time using the DfE's Attainment 8 measure. Once again, C of E schools do better on average than non-faith schools (+1.8 points) but this gap drops after controlling for intake (to +1.0 points). Catholic schools show a bigger gap (+2.8 points) but this is almost eliminated when comparing with similar non-faith schools (+0.7 points). Other Christian schools, though small in number (so handle any results with care), seem to display a more robust advantage: the raw difference of +3.7 points drops only to +2.9 points even after controlling for intake. Non-Christian faith schools show the biggest gap in raw attainment (+10.8 points) but most – though not all – of this disappears after controlling for intake (+3.2 points).
Figure 6: Secondary school attainment by faith school type (2018)
Another way to look at secondary school performance is to use the Progress 8 score. Unlike Attainment 8, which measures absolute GCSE performance, this takes into account each pupil's level of attainment at the beginning of secondary school (age 11) and measures the progress they make between this point and their GCSE exams (age 16). A Progress 8 score of zero indicates that the pupil has performed in line with expectations given their attainment at age 11; a positive score means they have done better and a negative one means they have done worse. In general, the story here is similar to the one we saw with Attainment 8. C of E schools have a small advantage over non-faith schools, but this halves after controlling for intake. More or less the same is true of Catholic schools. Other Christian schools show a small but material advantage even after controlling for intake. Non-Christian faith schools show a relatively large advantage, only about half of which seems attributable to intake. Note that these last two groups involved small numbers of schools (see the footnotes to Figure 7 for details), so those results should be treated with extra caution.
Figure 7: Secondary school progress by faith school type (2018)
Overall, there is some evidence for faith schools delivering better academic results, but the effects are patchy and most of what passes for superior school performance actually appears comes from advantageous pupil characteristics.
A class apart?
If faith schools are popular with some, they also receive criticism for being divisive. Whatever academic benefits there may be, do these come at the cost of increased segregation? Figure 8 summarises the results of an analysis in which the proportion of pupils at each state school who are eligible for free school meals (FSM) is compare with that at its closest 10 neighbouring schools. (For the time being, we are ignoring whether these proportions are higher or lower; we're just looking at absolute differences.) Among primary schools, non-faith schools show an average difference of 6.6 percentage points. C of E schools show a smaller gap, but the differences for other faith types are larger, with non-Christian faith schools showing the biggest mean disparity (9.0 percentage points). The picture among secondary schools is similar, though here even C of E schools show slightly higher differences than non-faith schools. (Use the menu in Figure 8 to switch between primary and secondary schools. Hover over the columns to see the corresponding data values.)
Figure 8: Imbalance in proportions of FSM pupils by religious denomination (2018)
Figure 9 shows the results of a slightly more sophisticated analysis using the same method as in our previous study of segregation in schools. Here we determine for each school whether it contains a higher or lower proportion of FSM pupils than would be expected by looking at other nearby schools, or whether it is broadly in balance (see Footnote 4 for details). Simply put, the larger the grey zone in each column, the more that group of schools tends to be in balance with others nearby. Among primary schools, Catholic and non-Christian faith schools show higher levels of segregation and tend to be biased towards more affluent families (indicated by the larger blue areas). Among secondary schools, all faith school types show greater segregation than non-faith schools, though other Christian schools and non-Christian faith schools show the highest levels. Here, too, they tend to attract more affluent families. Overall, non-Christian faith schools are about twice as likely to be socioeconomically segregated as non-faith schools.
Figure 9: Socioeconomic balance of schools by religious denomination (2018)
Figure 10 shows a similar analysis to Figure 8, but this time for ethnicity rather than socioeconomic status. As in our previous study, it compares proportions of White British pupils relative to all other ethic groups. Among both primary schools and secondary schools, Catholic and (especially) non-Christian faith schools stand out as having larger ethnic disparities than other faith groups, including non-faith schools.
Figure 10: Imbalance in proportions of White British pupils by religious denomination (2018)
Figure 11 repeats the analysis seen in Figure 9, but for ethnic segregation. Among primary schools, Catholic and non-Christian faith schools are the most segregated5. Catholic schools are more likely to have lower proportions of white British pupils than other nearby schools while C of E and other Christian schools tend to have more white British pupils. Among secondary schools, too, Catholic and non-Christian faith schools are the most segregated. Across both primary and secondary phases, non-Christian faith schools are about three times as likely to be ethnically segregated as non-faith schools. On a more positive note, C of E schools are similar in profile to non-faith schools and other Christian schools are more likely than average to be in balance with their local communities.
Figure 11: Ethnic balance of schools by religious denomination (2018)
Here endeth the lesson
Hopefully this analysis has helped to illustrate both some of the attractions of faith schools and some of the problems associated with them. They tend to do well academically, and even if this is largely a mirage caused by differential pupil intakes, it is understandable if parents find it reassuring. On the other hand, many faith schools appear to contribute to segregation, not only ethnically but socioeconomically too. Is this a price worth paying? From the point of view of a parent with their own child in mind, it may well be. But from a broader policy perspective, the case for faith schools must balance any perceived academic benefits with their effects on social cohesion.
Footnotes: